> ## Documentation Index
> Fetch the complete documentation index at: https://docs.staging.alpic.ai/llms.txt
> Use this file to discover all available pages before exploring further.
# Analytics
> Understand how your users interact with your MCP server.
### Overview
Alpic offers analytics to understand how your MCP server behaves and how your users interact with it.
All graphs are broken in two:
* The top part displays the aggregated data over the selected time period;
* The bottom part displays data over time for the selected period.
### Measured Metrics
MCP session counts and client breakdown
MCP request counts per feature
Average token usage per feature
Average response times per feature
Error counts per type
### Sessions
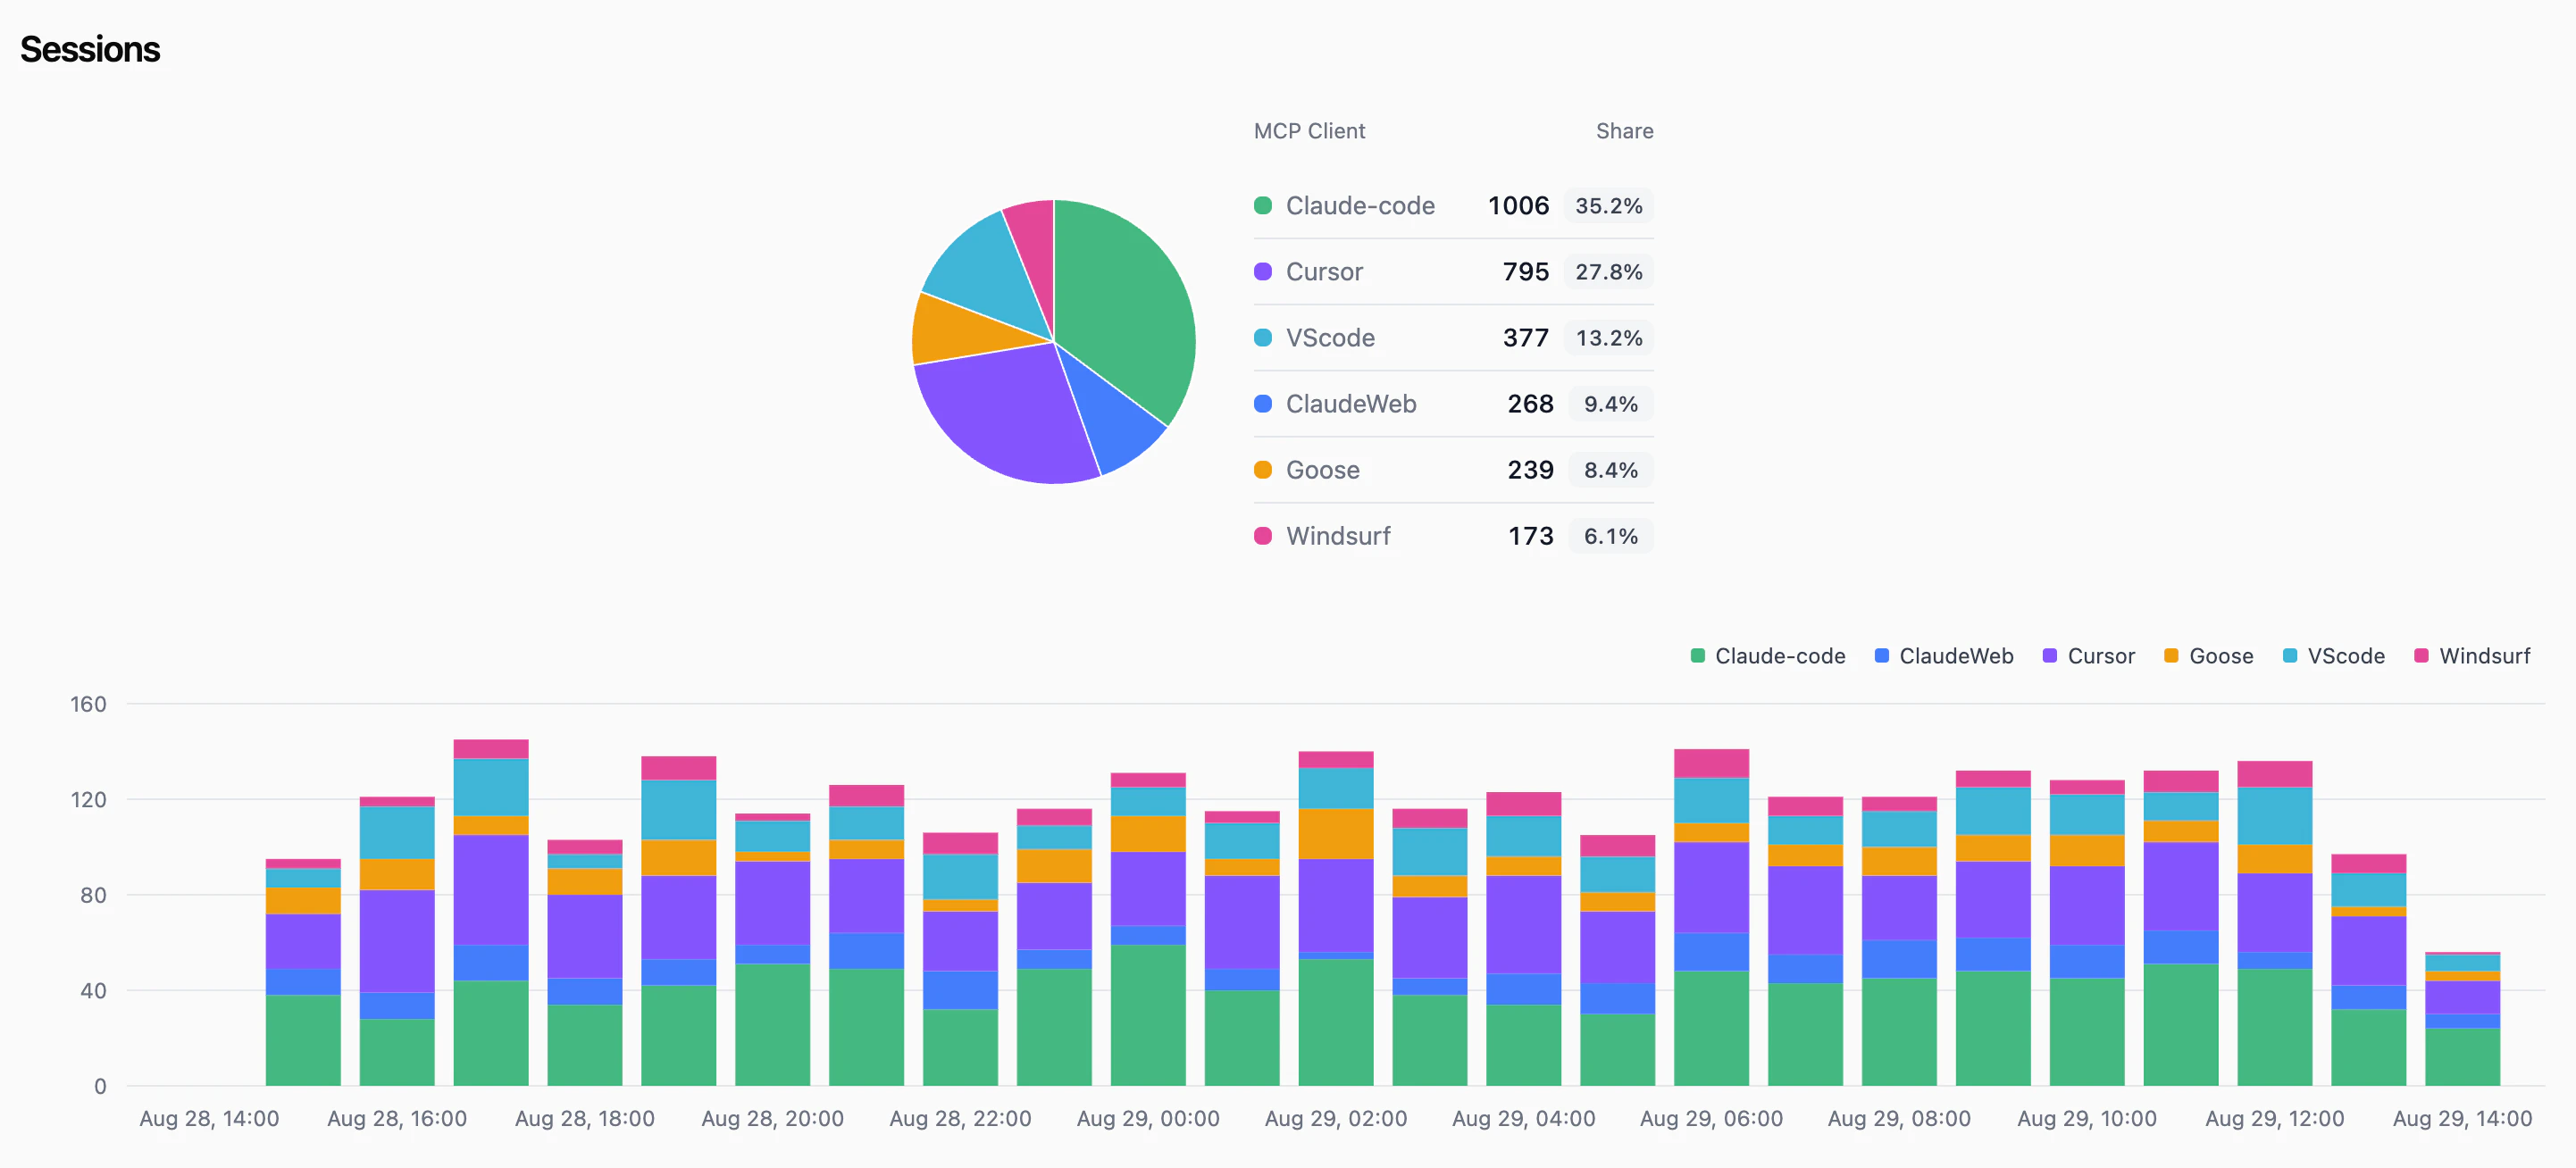
 Session graphs count the number of MCP sessions and break them down per MCP client.
A session corresponds to a new MCP [initialize request](https://modelcontextprotocol.io/specification/2025-11-25/basic/lifecycle#initialization). This request provides
client info, including the name of the MCP client used.
### Requests
Session graphs count the number of MCP sessions and break them down per MCP client.
A session corresponds to a new MCP [initialize request](https://modelcontextprotocol.io/specification/2025-11-25/basic/lifecycle#initialization). This request provides
client info, including the name of the MCP client used.
### Requests
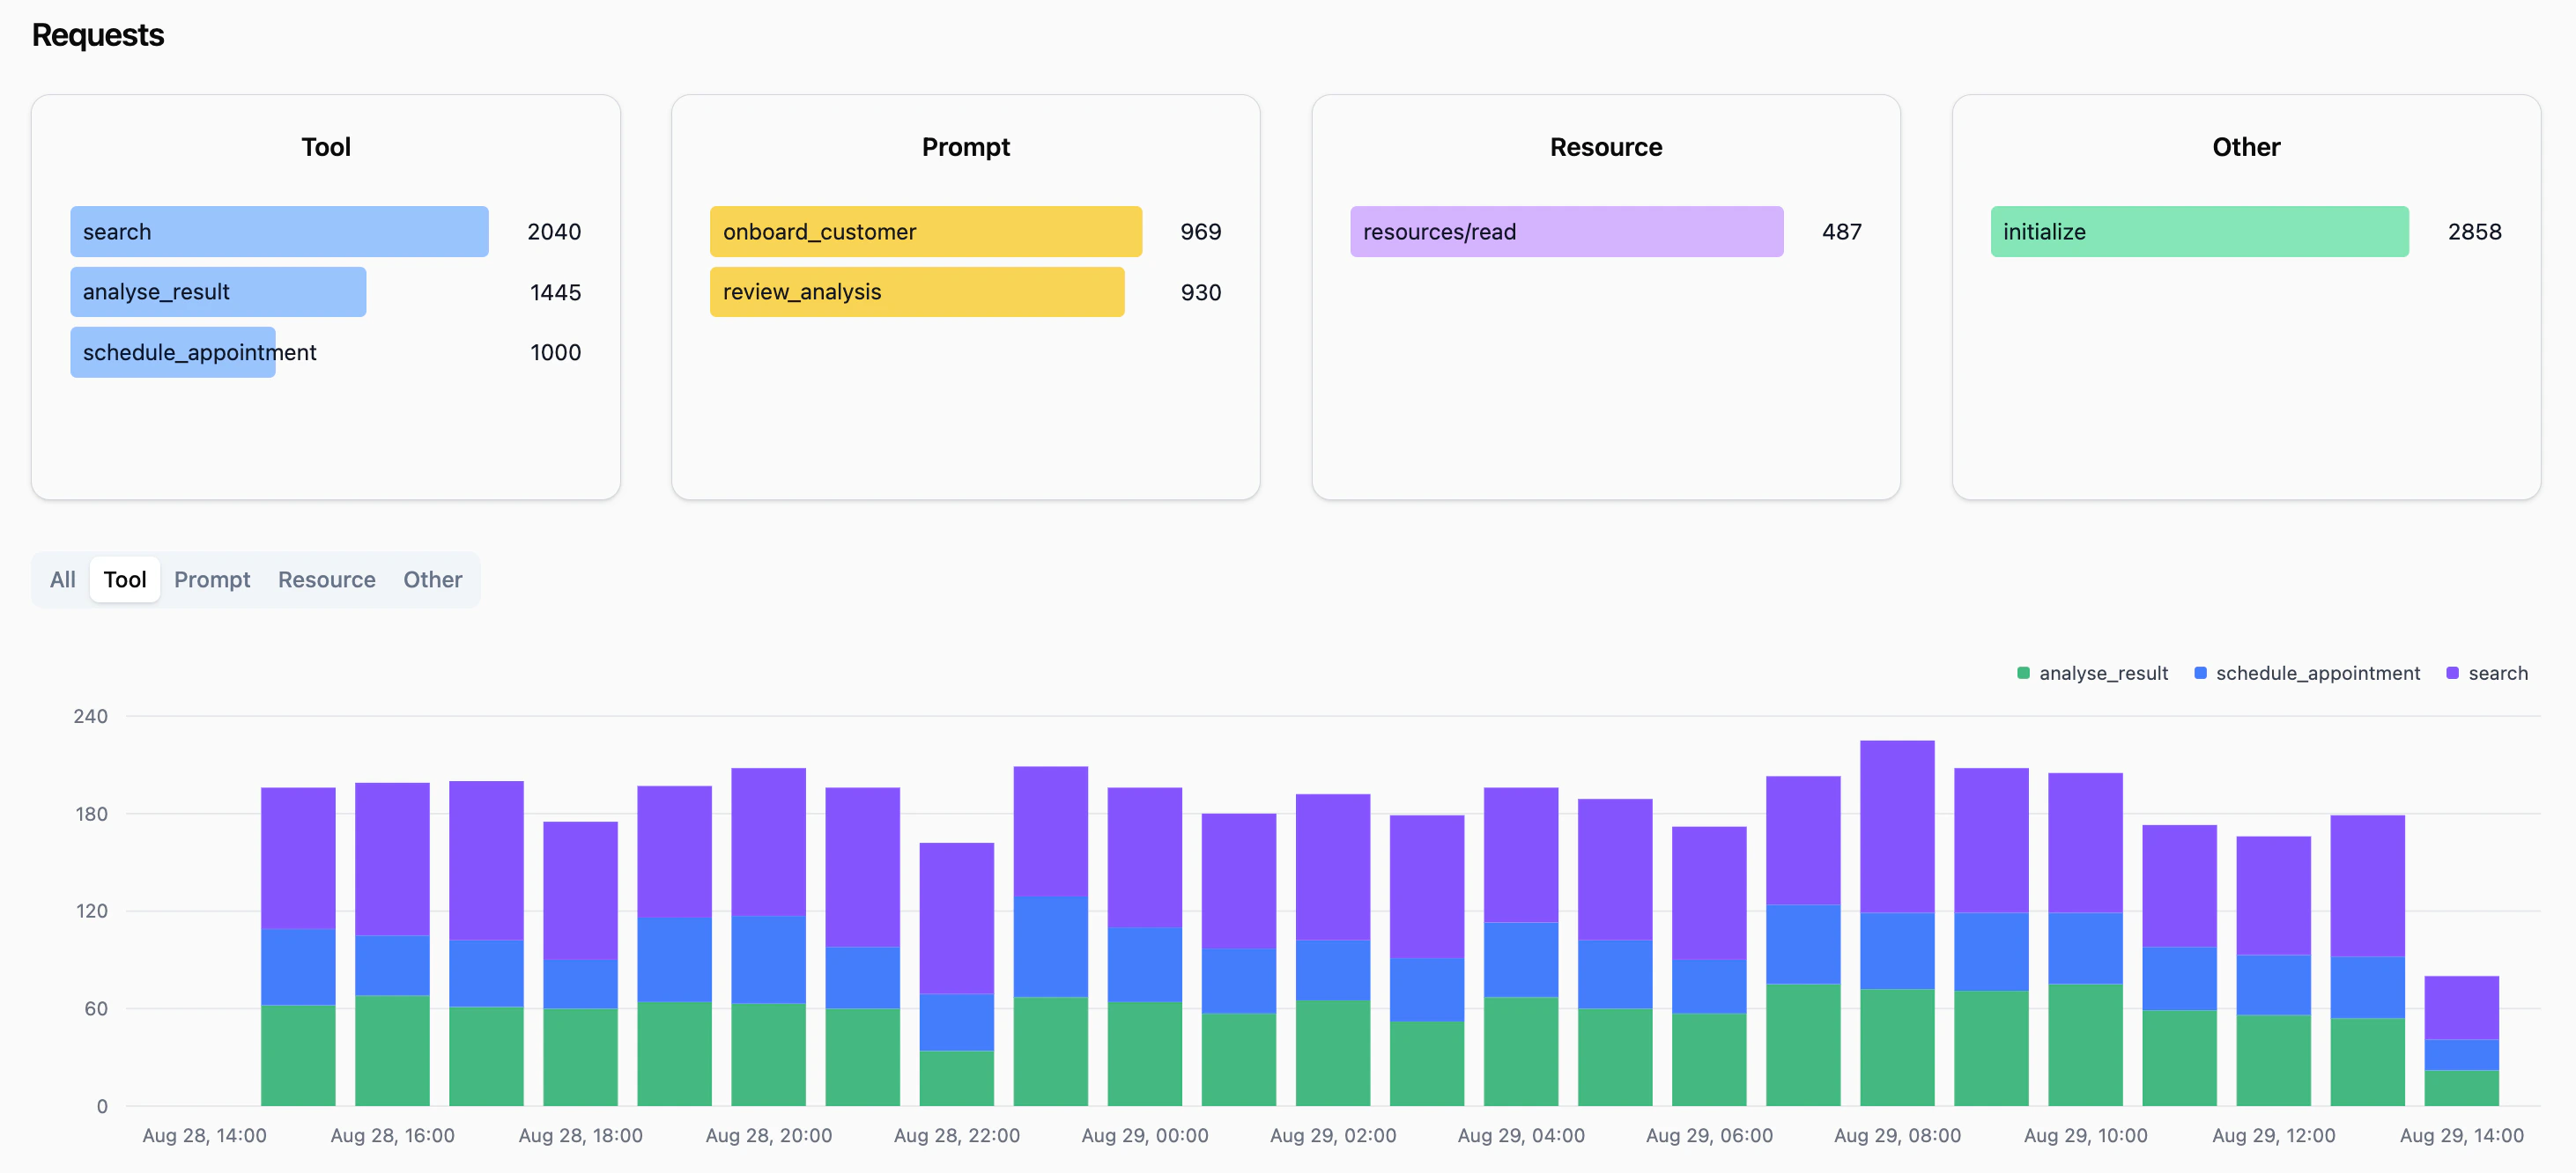
 Request graphs count the number of MCP requests received by your server and break them down per [MCP feature](https://modelcontextprotocol.io/specification/2025-11-25/server).
We group them into 4 categories:
* **Tool:** contains only `tools/call` requests
* **Prompt:** contains only `prompts/get` requests
* **Resource:** contains only `resources/read` requests
* **Other:** contains all other protocol requests including: `initialize`, `tools/list`, `prompt/lists`, `resource/list`.
All "Other" requests don't necessarily show active usage of your server as these requests are sent frequently by MCP clients if they are configured to connect to your MCP server.
### Average Output Tokens
Request graphs count the number of MCP requests received by your server and break them down per [MCP feature](https://modelcontextprotocol.io/specification/2025-11-25/server).
We group them into 4 categories:
* **Tool:** contains only `tools/call` requests
* **Prompt:** contains only `prompts/get` requests
* **Resource:** contains only `resources/read` requests
* **Other:** contains all other protocol requests including: `initialize`, `tools/list`, `prompt/lists`, `resource/list`.
All "Other" requests don't necessarily show active usage of your server as these requests are sent frequently by MCP clients if they are configured to connect to your MCP server.
### Average Output Tokens
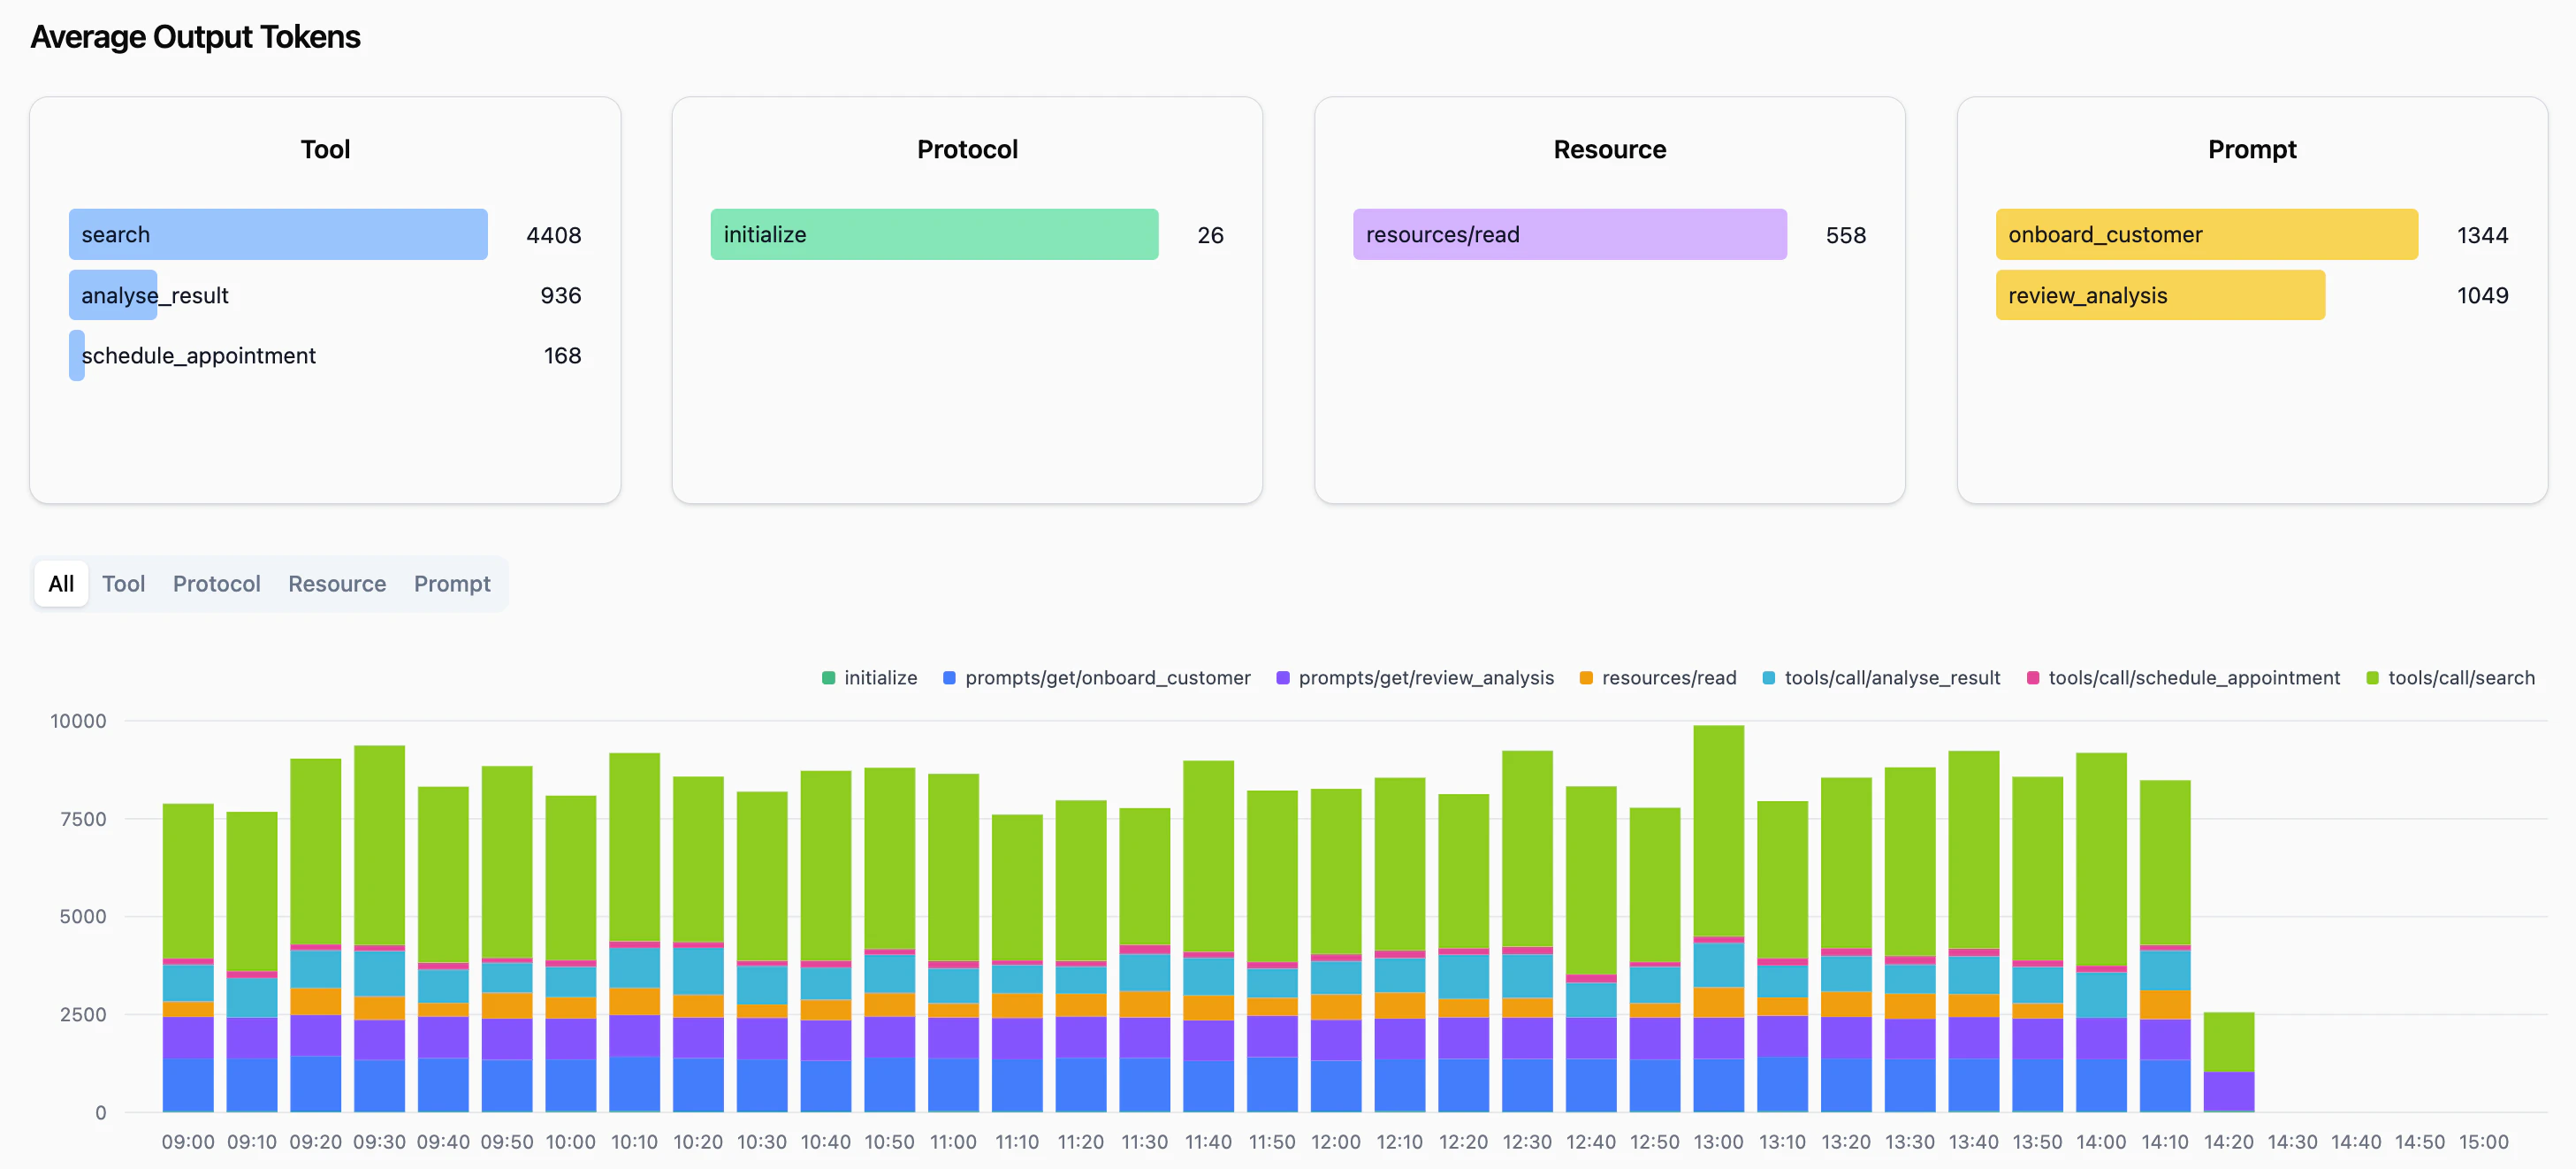
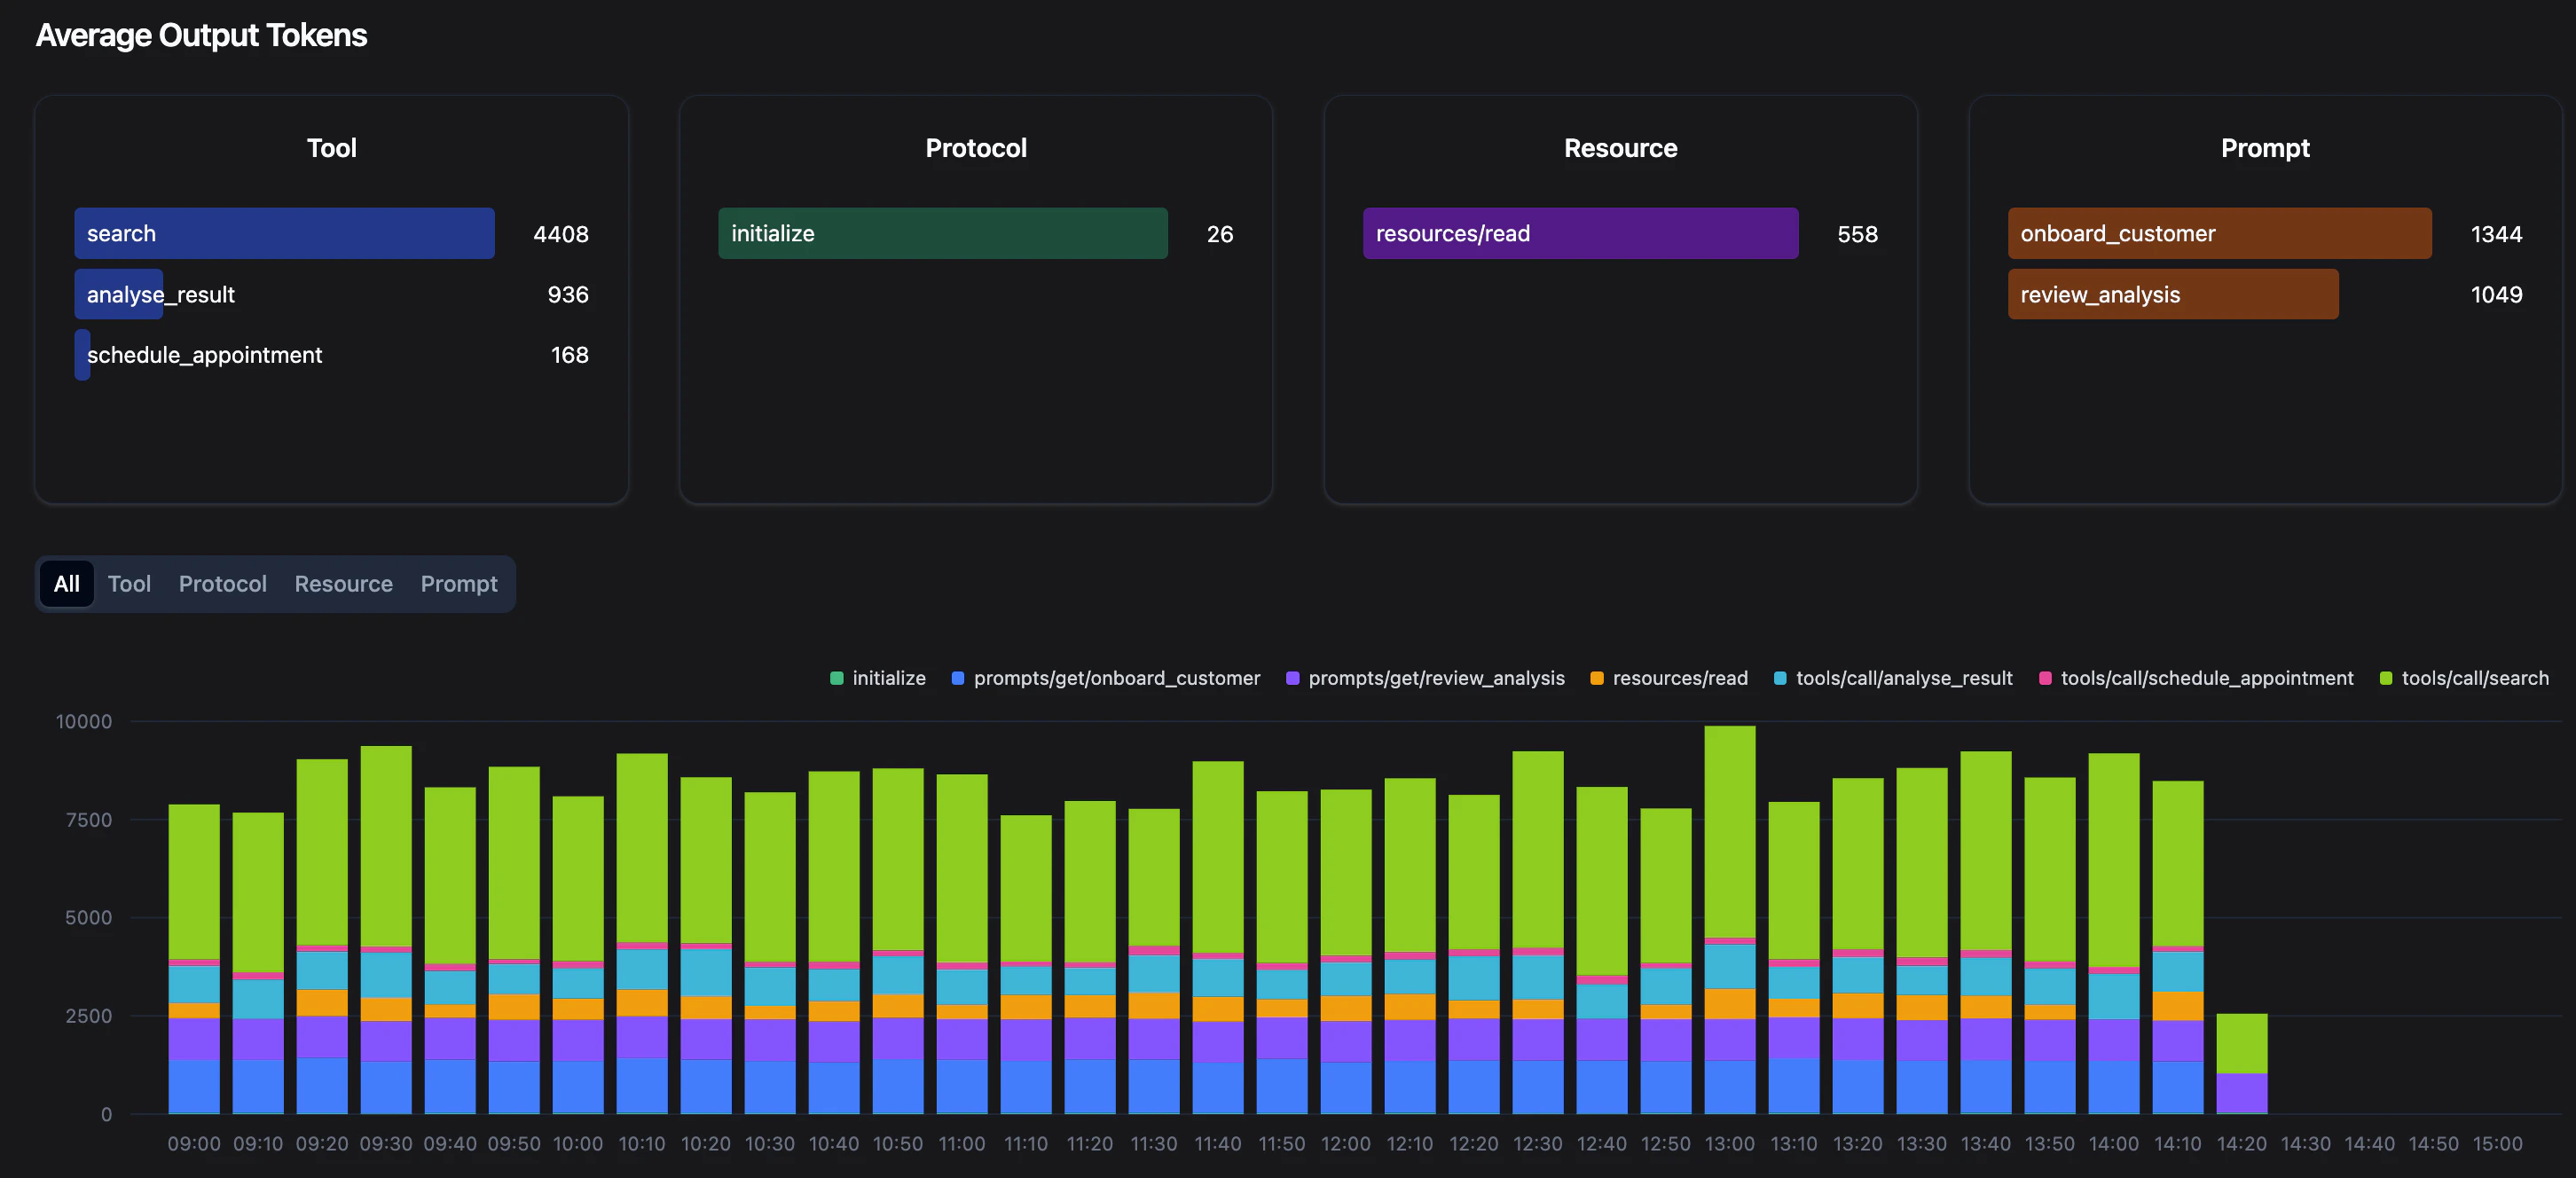 Alpic estimates the token equivalent of each part of the MCP responses that are passed to the LLM context window and breaks them down into each relevant [MCP feature](https://modelcontextprotocol.io/specification/2025-11-25/server).
The average output token graphs help you understand and track the filling of the LLM context between your different tools, prompts & resources. Note that the tools & server descriptions are also passed to the LLM via the `list/tools` & `initialize` requests.
### Mean Request Latency
The latency graphs displays the average latency (in ms) of the MCP requests hitting your server and breaks it down per [MCP feature](https://modelcontextprotocol.io/specification/2025-11-25/server).
### Errors
The error graphs count the number of requests erroring out after hitting your MCP server, broken down per [MCP feature](https://modelcontextprotocol.io/specification/2025-11-25/server).
We separate two types of errors:
* **Tool errors**: these are common, and correspond to a tool call result with the isError attribute set to true. These errors are designed to be passed to the LLM so that it can recover from them.
* **MCP errors**: these errors can result from a variety of causes and require your attention. They are not passed to the LLM and will usually impact the user experience, appearing as error messages in most MCP clients. Check out your logs if you see a spike of errors.
If you want to know more about how to design your errors properly, check out [this article](https://alpic.ai/blog/better-mcp-tool-call-error-responses-ai-recover-gracefully).
The quality of the protocol implementation vary depending on the MCP client, and can generate more errors than
expected. For instance, Claude asks for a list of ressources and prompts if you server doesn't advertise any, which
results in MCP errors that should be ignored.
Alpic estimates the token equivalent of each part of the MCP responses that are passed to the LLM context window and breaks them down into each relevant [MCP feature](https://modelcontextprotocol.io/specification/2025-11-25/server).
The average output token graphs help you understand and track the filling of the LLM context between your different tools, prompts & resources. Note that the tools & server descriptions are also passed to the LLM via the `list/tools` & `initialize` requests.
### Mean Request Latency
The latency graphs displays the average latency (in ms) of the MCP requests hitting your server and breaks it down per [MCP feature](https://modelcontextprotocol.io/specification/2025-11-25/server).
### Errors
The error graphs count the number of requests erroring out after hitting your MCP server, broken down per [MCP feature](https://modelcontextprotocol.io/specification/2025-11-25/server).
We separate two types of errors:
* **Tool errors**: these are common, and correspond to a tool call result with the isError attribute set to true. These errors are designed to be passed to the LLM so that it can recover from them.
* **MCP errors**: these errors can result from a variety of causes and require your attention. They are not passed to the LLM and will usually impact the user experience, appearing as error messages in most MCP clients. Check out your logs if you see a spike of errors.
If you want to know more about how to design your errors properly, check out [this article](https://alpic.ai/blog/better-mcp-tool-call-error-responses-ai-recover-gracefully).
The quality of the protocol implementation vary depending on the MCP client, and can generate more errors than
expected. For instance, Claude asks for a list of ressources and prompts if you server doesn't advertise any, which
results in MCP errors that should be ignored.